
DebugView is a tool created by Microsoft that lets you capture the debug output of your applications, such as a Voice Elements-based IVR Solution. It can be a valuable tool for determining why an application is having issues. Issues that don’t show up in the EventViewer or in an application’s logs can often be captured in DebugView.
It can be downloaded here.
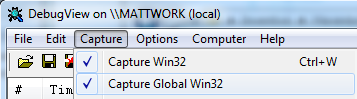
You do not need to install DebugView, you should be able to extract it to any directory you would like and begin running the application. To make sure that you capture each item, make sure that you enable Capturing Global Win32. You can do this by going to “Capture > Capture Global Win32”. Please see the image below for reference:
Lastly, you will want to select “File > Log to File As”, and choose a filename. This will cause DebugView to save the output automatically to a file.
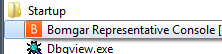
Once DebugView has started, you will want to run the application(s) that you are having difficulty with. Alternatively, you can set DebugView to start up with Windows, by copying it to your startup directory in your start menu, as in the image below:
When debugging, we recommend that you add DebugView to your startup menu, this way it is always running.
If you have forgotten to enable the “Log to file As” option using DebugView, you can save the output, by going to “File > Save As “, it will save as a Log file that you can send to others.